Experimenting at Typeform from the Engineering perspective
This post was originally published on the Typeform Engineering Blog.
I’m Miquel, an Expert Frontend Engineer at Typeform. When I joined the company in 2021, I landed in a team running experiments across our product. It was my first experience on a data-driven team, and it was completely new to me. This experimentation mindset helps you better understand the business and how your users behave when you change their habits.
Since then, I’ve learned how crucial the right experimentation environment is for making a real impact in your organization. In this post, I’ll walk you through our experimentation lifecycle from an engineering perspective and share the lessons I’ve learned over the past four years.
What is an experiment?
Before diving into the lifecycle of an experiment, let’s first define what an experiment is and why we need them. An experiment — or A/B test — exposes users to different versions of a specific flow or feature in your product. We compare the current version (the “control”) against one or more new ones (the “variants”).
Users are randomly assigned to each experience. The goal is to understand which version performs better. This helps us iterate on the product in a controlled and safe way, so we can make informed decisions when rolling out new changes.
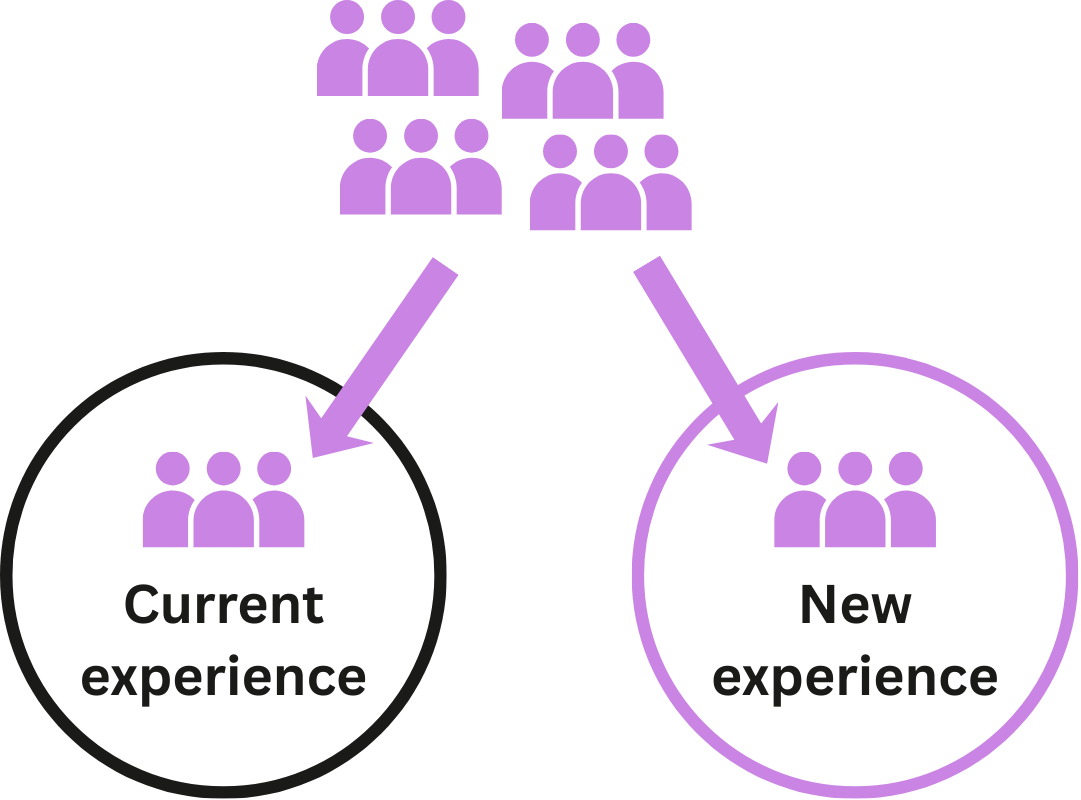
Representation of how the users are assigned to the different experiences.
Tools we use
At Typeform, we use different tools for each stage of the experiment lifecycle. This is the stack we use for product experiment (we use different tools for our site and email marketing):
- LaunchDarkly. We use it to orchestrate experiments and randomly assign users to different experiment groups.
- Segment. We capture metrics across our platform and send them to Amplitude and Fullstory through Segment.
- Amplitude. It provides visualization tools to monitor granular insights and track directional data on ongoing experiments.
- Fullstory. It provides heat maps and recorded user sessions that help us understand customer behavior and spot bugs.
- GrowthBook. We use it for post-experimentation analysis. It’s our source of truth for deciding whether to roll out or roll back an experiment.
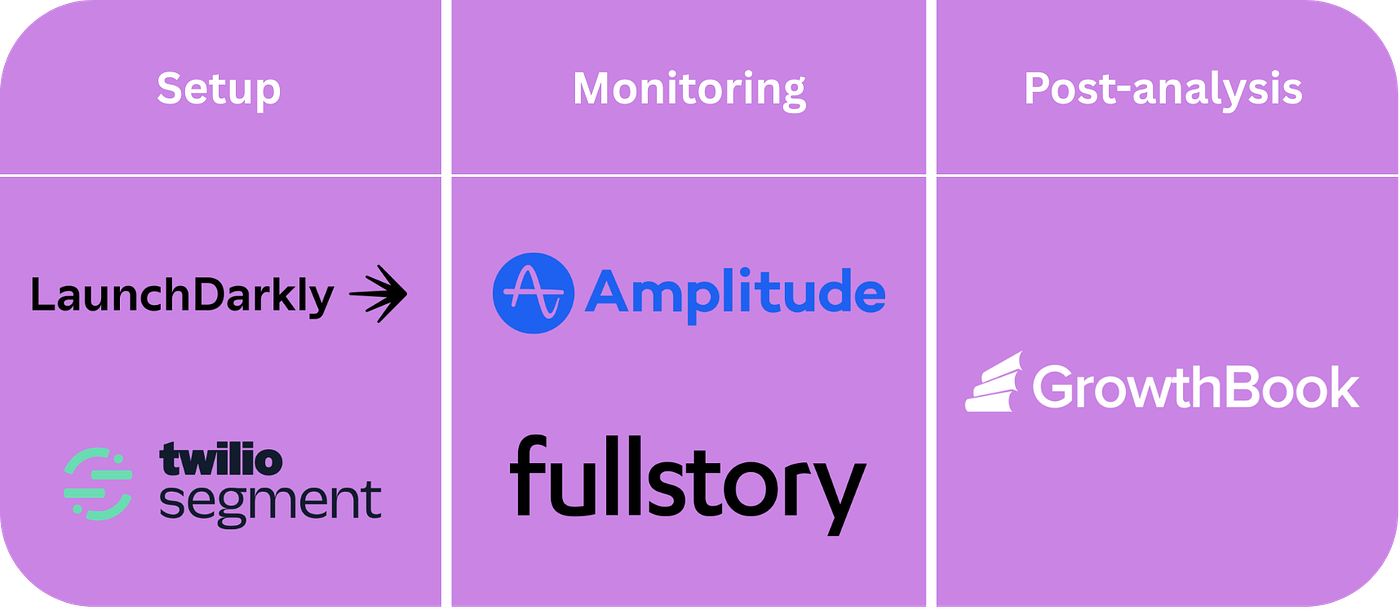
Tools we use at Typeform in the different stages of the experimentation flow.
Lifecycle of an experiment
The best way to explain the lifecycle of an experiment is through an example. I’ll use a recent experiment from my team to walk through the different steps we followed.
At Typeform, we recently released a new product called Typeform AI. With Typeform AI, users can create and edit their forms conversationally, helping them build better forms faster. When creating a new typeform, we show customers a few options to speed up content generation — the “Create Wall.” Since Typeform AI is ideal for starting a new form, we decided to make it more prominent in the Create Wall. We created two versions to see which performed better.
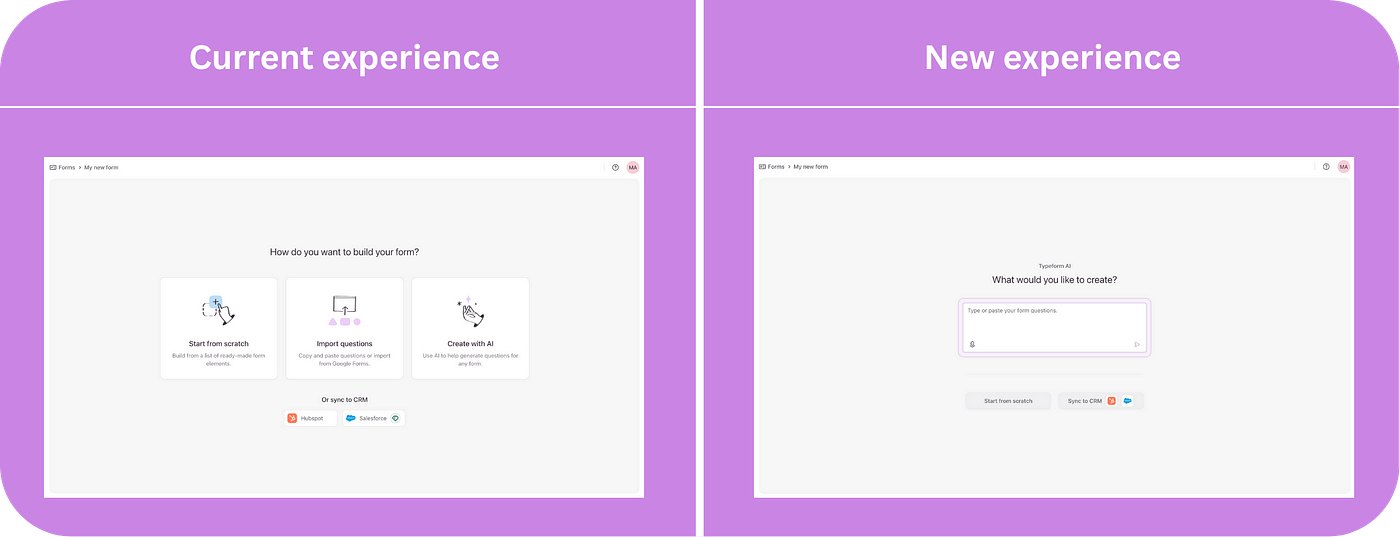
Example of an experiment done in the “Create Wall” view of the form creation flow.
Defining the right metrics
Before running an experiment, start by understanding why. Begin with a hypothesis, then define metrics to validate it. You’ll need a primary metric that captures the experiment’s main goal, a few secondary metrics you also expect to influence, and guardrail metrics to ensure the test doesn’t introduce negative side effects.
A metric is your hypothesis translated into math. Uncertainty about what to measure often indicates that the link between the problem and the solution needs to be clearer. — Cecco Mora, Expert Data Analyst at Typeform
In our example, the hypothesis was: “If Typeform AI helps users create their forms, more users will publish a form, driving publication rate up.” We tracked publication rate as our primary metric, conversion to paid plan as a secondary metric, and adoption of other key features as guardrail metrics.
Setting up the experiment
Once our metrics are ready, we are ready to set up everything we need to run the experiment. With our stack, we do the following:
- We add tracking events to measure customer interactions. We do this at the code level and use Segment to send the events to the other tools mentioned above.
- We create the feature flag in LaunchDarkly with three user groups: “variant” (new experience), “control” (current experience), and “out of experiment” (current experience, but excluded from monitoring and analysis). I’ll explain why we need three groups in the next section.
- We develop the new experience and show it only to users in the “variant” group. At Typeform, we have a set of APIs that tell us if a user is exposed to a specific feature flag.
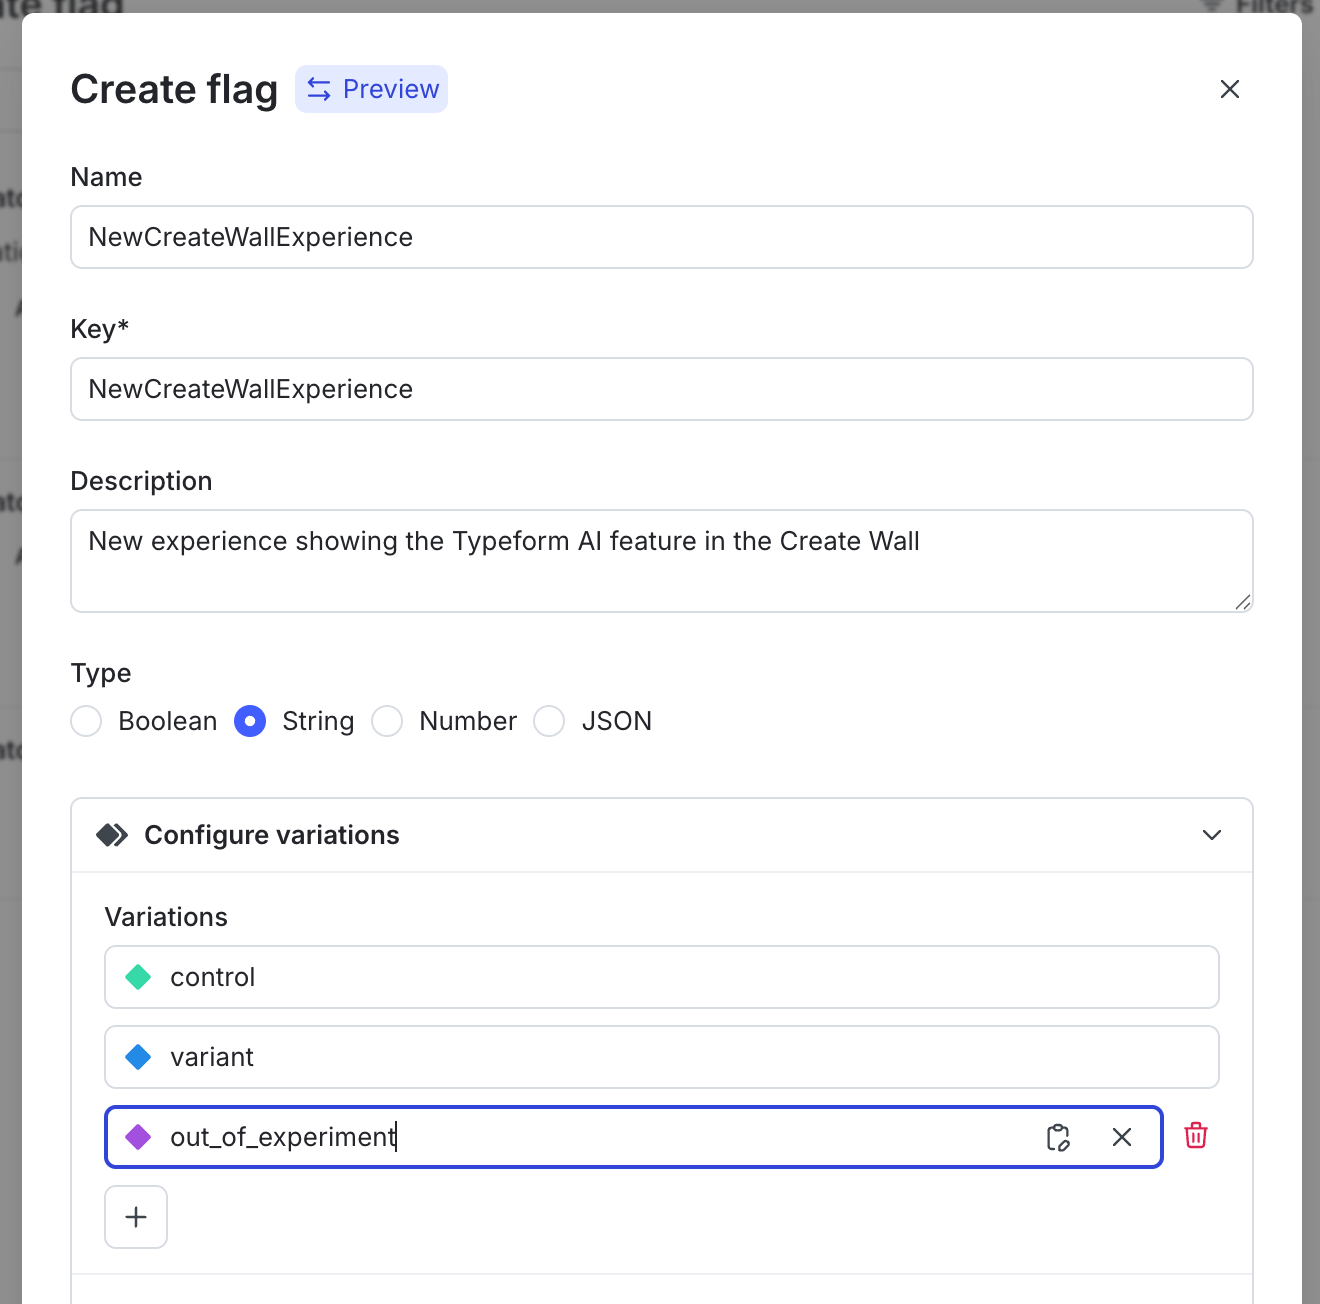
Feature flag creation modal in LaunchDarkly.
Starting the experiment
Once we have everything ready, we can start the experiment. We do this directly in LaunchDarkly, but it’s not as simple as clicking a button — there are some important considerations:
- The “control” and “variant” groups must always be balanced. The “out of experiment” group helps allocate the rest, who are excluded from the analysis. For example, you might expose the experiment to 40% of users — 20% variant and 20% control — with the remaining 60% in the “out of experiment” group.
- You don’t need to expose the experiment to all users at once. You can start with 10% and gradually increase until you reach 50% variant and 50% control (with 0% out of experiment). Alternatively, you can expose it to a specific subset of users first, such as new sign-ups.
- Experiment duration matters and depends on the number of users exposed and how visible the feature is, among other metrics. In our case, GrowthBook helps us determine when we have enough data to conclude the experiment.
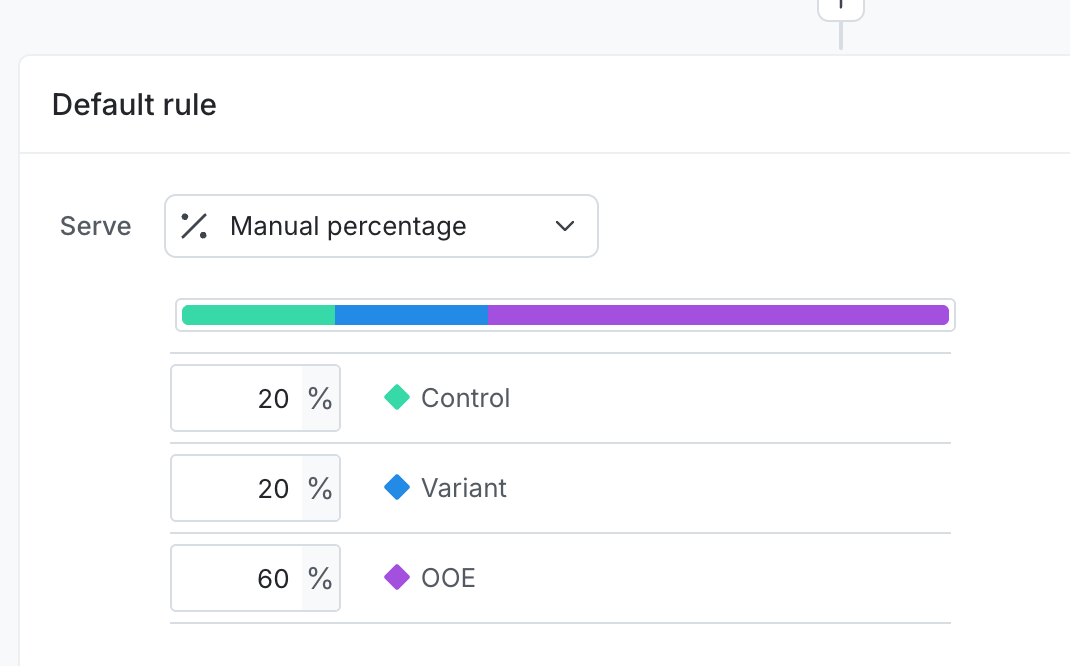
Example of group assignment in LaunchDarkly.
Monitoring the experiment
Our experiment is live! Now it’s time to wait for the results. In the meantime, there are several issues and potential problems we can monitor:
- Unbalanced groups are a problem. For example, if you see more users allocated to the “variant” than the “control,” the results may be biased and invalid.
- Inconsistent user assignment. If a user is first assigned to the “variant” group and then switches to the “control” group, something wasn’t configured correctly.
- Variant leakage. This happens when a user who shouldn’t see the variant experience ends up seeing it.
- Poor tracking. Sometimes, after the experiment starts, we realize the tracking we set up isn’t enough to understand the impact of the new experience. Don’t panic — it’s completely fine to add the necessary tracking while the experiment is running.
- UX bugs. Regularly check Fullstory sessions, review Amplitude’s granular funnel views, and monitor reports from your customer support team to spot bugs that may affect the experiment’s results. Amplitude also lets you configure alerts based on sudden metric changes.
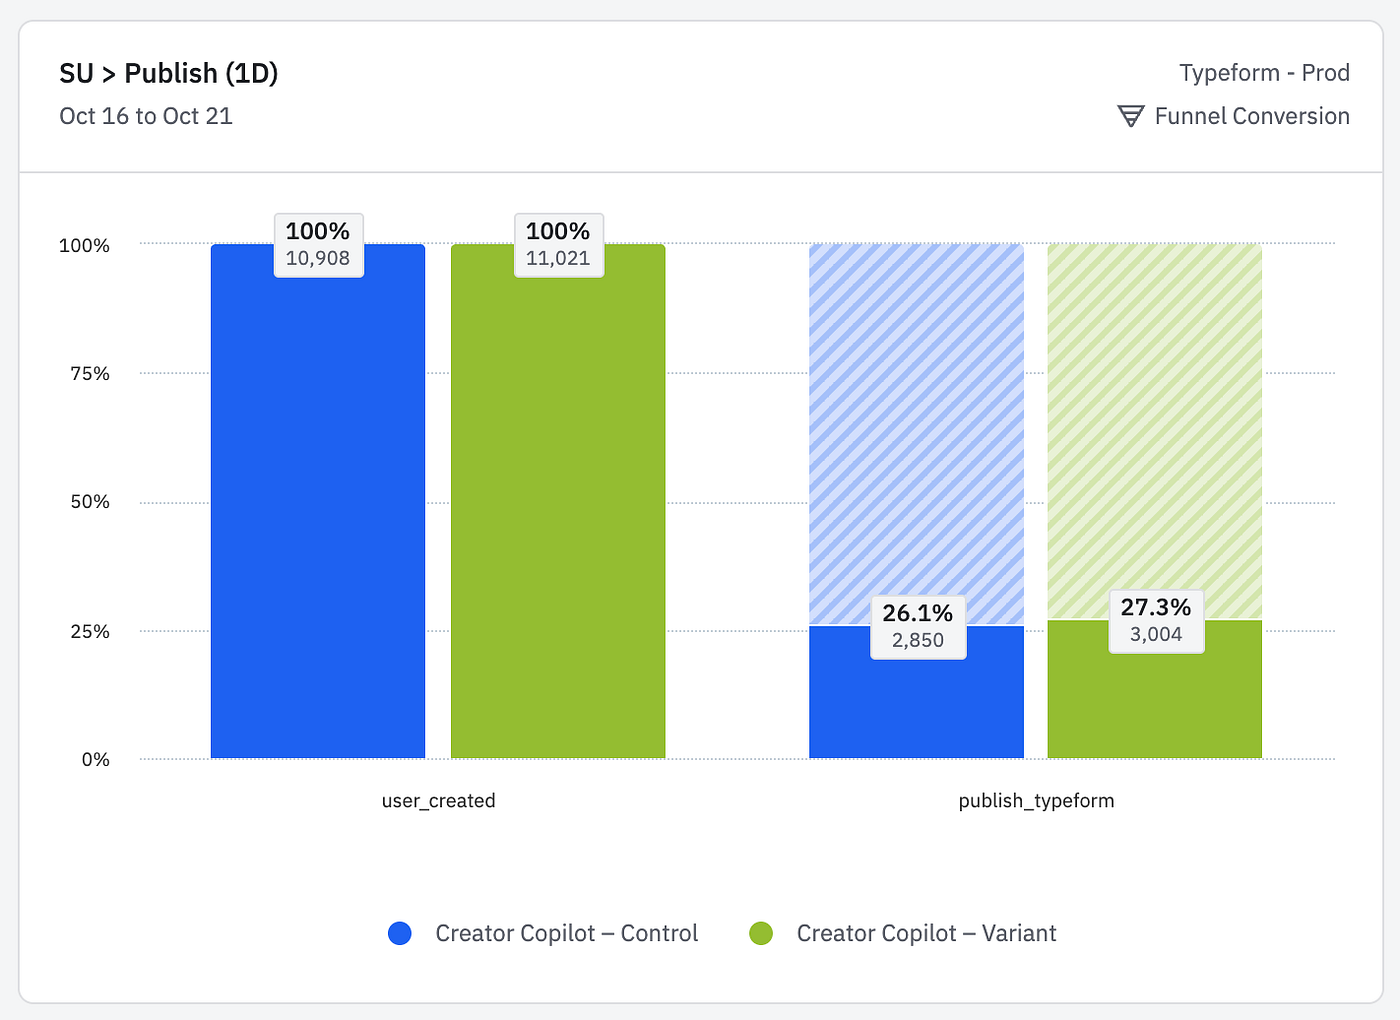
Example of a chart in Amplitude showing the users who signed up and published within a 1-day window.
Analyzing the results and iterating
Once we have enough data, should we roll out the experiment to all users or discard it? The truth is, even if an experiment doesn’t perform well, we gain valuable learnings that help us iterate and try different approaches.
In our case, we use mainly GrowthBook for the post-analysis but it’s also a good practice to combine it with Amplitude and Fullstory to add more context to the decision. GrowthBook is the source of impact and truth, and gives you information about each of the metrics of the experiment and how they changed depending on the groups you defined.

Example of how the results of an experiment look in GrowthBook.
Takeaways
To conclude, I would like to share some key learnings of my experimentation journey that hopefully will be useful for you, whether your organization is already experimenting or not:
- Transforming Typeform into a data-driven organization has helped us build a culture of trial and error. It gives you control over metrics while providing learnings to continuously iterate on your product.
- This is the stack that works for us, but many alternatives are available in the market. You don’t need everything set up from the beginning — the key is to start, even if it’s only with a specific team.
- Don’t assume new features will be easily adopted by your customers. Sometimes what we think are trivial changes — or obvious improvements — end up performing poorly. That’s where experimentation is key.
- At some point, once you have been experimenting for a while, it’s a good idea to standardize the experimentation process. This creates consistency and enables other teams in your organization to follow the same process.
Special thanks to Pol Borrellas, Lead Product Manager at Typeform, and Cecco Mora, Expert Data Analyst at Typeform, for their feedback and insights on the topic.
Happy experimentation!